"More data" is not your problem
Most indoor farms think they need thousands of crop cycles and a data science team to forecast harvest dates and yields. In reality, the biggest wins in 2026 will come from growers who squeeze real predictions out of the small sensor datasets they already have.
A recent Scientific Reports paper introduced a correlation square based k-nearest neighbor (CorrSquare-kNN) classifier that does exactly that: it boosts prediction accuracy on tiny datasets by paying attention to how features relate to each other, not just how big your dataset is.
This article turns that research into a practical, no-BS playbook for hydroponic growers. We will use the streams you already log - EC, pH, water and air temperature, PPFD/DLI, VPD, dissolved oxygen, sometimes CO₂ and flow rate - and show how to:
- Predict harvest windows for leafy greens and fruiting crops with a handful of past runs
- Estimate yield per channel, per bucket, or per tower
- Run it on-edge on a Raspberry Pi or similar box with Node-RED or Python
- Improve accuracy over time without ever touching deep learning
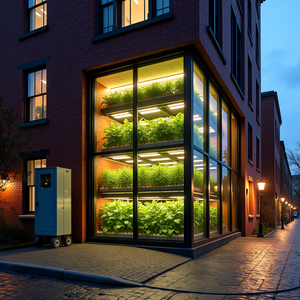
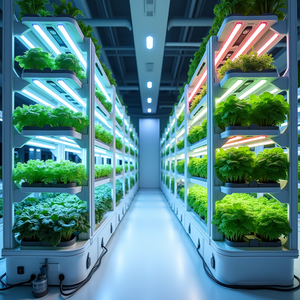
1. The Scenario: A small farm drowning in logs, not insights
Imagine a 60 m² indoor farm running a mix of DWC tubs, a small NFT line for lettuce, and a Kratky shelf on the side for herbs:
- You already log EC, pH, air temp/RH, water temp, and light schedule.
- Maybe you have PPFD/DLI readings per zone and a basic VPD calculation.
- You weigh a sample of harvest crates and record dates in a spreadsheet.
Yet every cycle you still have the same headaches:
- Some NFT channels hit target weight 3 days early, others 4 days late.
- Buyer commitments are tight: “20 kg of basil next Friday” means you are either scrambling or overgrowing.
- You have months of sensor history but no reliable way to say: “This batch will be ready between day 25 and 27 at 1.2–1.4 kg per channel.”
That is the exact pain a small-data method like CorrSquare-kNN can attack.
Instead of chasing “big data,” we lean on limited, high-quality runs and smarter distance metrics between them.

2. The Breakdown: What CorrSquare-kNN actually does (in grower language)
Standard k-nearest neighbor (kNN) is simple: it looks at your new data point (for example, today’s average EC, pH, temp, DLI at day 16 of the run) and finds the most similar past runs in your historical dataset. It then uses those neighbors to predict something, like “days until harvest” or “expected yield.”
The problem in hydroponics is you rarely have hundreds of nearly identical runs. You have 10, maybe 30, and they differ in setpoints, season, cultivar, and system type. Standard kNN tends to treat all features equally and use simple distance (like Euclidean) across normalized values, which can be noisy in small datasets.
The CorrSquare-kNN paper introduces a different way to measure similarity. Instead of only looking at raw values, it looks at how features co-vary and uses a correlation-based distance (squared correlation) as its core. In practice, that buys you three useful things for small farms:
- Feature relationships matter. For instance, the way VPD and DLI move together on a sunny winter day vs a cloudy summer day tells you more about plant stress than either metric alone.
- More robust with few samples. Correlation-based distances can handle small datasets better, as they emphasize structure rather than volume.
- Works with mixed sensor sets. You might have DO on your DWC tanks but not on your NFT lines; CorrSquare-style methods can still pick useful neighbors based on overlapping behavior.
Recent work in small-data ML for protected cultivation echoes the same idea: combining simple models with richer feature engineering often outperforms heavier architectures on small greenhouse datasets, especially for classification and regression tasks tied to growth stage and yield.
For us, that translates to: you can stay in the shallow end of ML, keep code simple, and still get meaningful predictions.
What you will actually predict
To keep this grounded, we will focus on two core predictions:
- Harvest date window - “This batch will hit target weight 8–10 days from now.”
- Expected yield - per channel, bucket, or tower (e.g., grams of lettuce per NFT channel, grams per DWC lid).
Both can be built on top of CorrSquare-style kNN using the same sensor history.

3. The Action Plan: Building a small-data prediction loop for your farm
Step 1: Decide the level of prediction
Before you touch ML, decide what you are predicting and at what granularity:
- Crop type: lettuce, basil, spinach, or a specific cultivar.
- System: Kratky tubs, DWC buckets, NFT channels, or towers.
- Unit: per site, per channel, per square meter, or per harvest crate.
For a first deployment, keep it simple: choose one crop and one system (for example, “Butterhead in NFT, yield prediction per channel” or “Genovese basil in DWC, harvest date per lid”).
Step 2: Structure the data you already have
Even a messy log file or CSV can be turned into a model-ready dataset. You want each row to represent a batch or a batch-day, and each column a feature:
- Batch identifiers: crop, cultivar, start date, system type.
- Environment & solution: daily averages or medians of EC, pH, air temp, RH, water temp, VPD, PPFD or DLI, DO (if you have it), tank volume, flow rate (NFT).
- Management: nutrient changes, pruning dates, transplant date, photoperiod changes.
- Targets:
- Harvest date (convert to “days from transplant to harvest”).
- Yield per unit (grams per channel, grams per lid, grams per tower).
Two useful ways to represent time:
- Static per-batch features: summarise the entire run: average EC, standard deviation of EC, average DLI, number of stress events (for example, water temp > 24°C for DWC).
- Snapshot features: use data from a certain day or window, like day 14 post-transplant, or a 3-day window around it. This is powerful for “mid-cycle” predictions.
CorrSquare-kNN works well with either, but snapshot features are friendlier to on-edge deployment because the math stays lightweight.
Step 3: Engineer features that actually matter for hydroponic growth
The correlation-based distance shines when your features are meaningful. For leafy greens and herbs in Kratky, DWC, and NFT, good starting features include:
- Solution control:
- Mean EC, standard deviation of EC, count of days outside target band.
- Mean pH, standard deviation of pH, count of pH corrections.
- Temperature & VPD:
- Mean air temp, mean water temp, max water temp.
- Mean VPD, hours per day in target VPD band.
- Light:
- Mean DLI in the period, variation between days.
- If you only have PPFD at canopy: PPFD × photoperiod to approximate DLI.
- Oxygen for water culture (DWC/Kratky):
- If DO is available: mean DO, minimum DO.
- If not: proxy features like water temp plus aeration type (stone vs diffuser vs none) and whether it is passive Kratky.
Peer-reviewed greenhouse yield models consistently highlight integrated light (DLI), temperature, and nutrient control as the main drivers for biomass prediction in small datasets, especially when combined with simple models like kNN and regression as summarized in recent small-data ML studies.
Step 4: Implement CorrSquare-style kNN in simple code
You do not have to reproduce the paper’s math line by line to get value from it. You need two components:
- A correlation-based distance metric between feature vectors.
- A basic kNN loop that returns the “k most similar past runs.”
A practical approach on a Raspberry Pi:
- Option 1: Node-RED
- Store your history in InfluxDB, SQLite, or a CSV file.
- Use a function node (JavaScript) that:
- Pulls the current batch’s feature vector.
- Computes correlation coefficients with each past batch, squares them, and turns them into distances (for example, distance = 1 − r²).
- Sorts by smallest distance and picks top k.
- Option 2: Python script on the Pi
- Store your dataset in a CSV.
- Use
pandasandnumpyto calculate correlation-based distance. - Wrap it in a simple REST API with
Flaskif you want Node-RED or your dashboard to call it.
For each new prediction request, you feed in the current feature vector, get back the top k similar batches, and then:
- Average their harvest days to estimate “days remaining.”
- Average their yields to estimate expected grams or kilograms.
You can also treat this as a classification problem, like the Scientific Reports study: classify current state as “early,” “mid,” or “late” growth stage, then map that to expected days to harvest.
Step 5: Close the loop with real feedback
None of this matters without feedback.
- Log the model prediction: “Predicted harvest in 9 days at 1.3 kg/channel.”
- At harvest, log actual harvest date and yield.
- Update your dataset weekly and re-train (for kNN, retraining is just reloading the dataset).
Within 5–10 cycles, you will see whether your feature set and correlation-based distance are working. If the prediction error is stuck, you tweak features or k, not your entire infrastructure.

4. Benchmarks & Metrics: When is your small-data ML “good enough”?
You are not competing with Silicon Valley here. You are competing with your current guesswork and mental math. “Good enough” is when the model gives you tighter, more reliable windows than your gut.
Key accuracy metrics to track
- Mean Absolute Error (MAE) in harvest days: Average of |predicted harvest day − actual harvest day|.
- Practical target: ≤ 2 days for fast crops like lettuce and basil.
- MAE in yield per unit: Average of |predicted yield − actual yield| per channel/lid/tower.
- Practical target: ≤ 15% error for leafy greens in small systems.
- Bias: Are you consistently overestimating or underestimating?
Studies on sensor-based yield prediction in greenhouses and controlled environments show that even simple models can hit 5–15% yield error with well-chosen features and well-calibrated sensors, as reported in recent precision agriculture ML work referenced by Scientific Reports. You do not need perfection. You need predictable error.
Operational benchmarks for a working system
Use these as practical checkpoints:
- After 5–10 batches:
- Harvest date MAE under 3 days.
- Yield MAE under 20% for your main crop.
- After 20+ batches:
- Harvest date MAE creeping toward 1–2 days.
- Yield MAE 10–15% or better.
If you do not see improvement as data grows, revisit:
- Sensor calibration (especially EC, pH, and light).
- Feature definitions (for example, use DLI instead of “hours lights on”).
- Segmentation (build separate models per cultivar or season instead of one model for everything).
How this tightens your farm operations
Once your CorrSquare-style kNN model hits those benchmarks, you can start treating predictions as part of operations:
- Scheduling: Plan transplants and staggered sowings based on predicted harvest windows instead of fixed calendars.
- Sales commitments: Accept orders based on forecasted yield ranges, with a buffer equal to your MAE.
- Resource use: Compare predicted vs actual yield per kWh and per liter of nutrient solution.
That is where small-data ML actually earns its keep: fewer surprises, fewer emergency discounts, more predictable cash flow.
Bringing it all together
Small-data ML, especially correlation-aware kNN like CorrSquare-kNN, is a natural fit for indoor hydroponic farms. You are already collecting the hard part: sensor data and harvest records. The missing link is a lightweight model that connects the two.
If you:
- Clean up your historical logs into a simple table,
- Engineer features that match plant physiology (EC, pH, DLI, VPD, temperature, DO), and
- Use a correlation-based kNN on a cheap edge device,
you can turn your existing Kratky tubs, DWC buckets, NFT channels, and towers into a predictable production line instead of a series of educated guesses.
No deep learning, no cloud bill, no huge dataset. Just smarter use of the runs you have already sweated through.
As an Amazon Associate, I earn from qualifying purchases.